


The fishbone diagram applied to logistics
The fishbone diagram is a valuable tool for identifying why a process goes out of control, which is crucial for restoring it and raising productivity.
What is the fishbone diagram?
The fishbone diagram — also known as the Ishikawa or cause-and-effect diagram — is a tool used to detect and visualise the origins of a problem. This diagram, developed by Japanese engineer Kaoru Ishikawa in 1943, helps solve issues that affect the efficiency, quality or any other critical aspect of a storage system, handling equipment or logistics process.
What is the structure of the fishbone diagram?
The shape of this diagram resembles the spine of a fish. In it, the head represents the problem or effect to be analysed, while the fishbones are the different types of possible causes. Each main category may have sub-causes that branch out from its fishbones. These are more specific and allow for more precise identification of the reasons.
What are the 6 Ms of the fishbone diagram?
Possible triggers are organised into several main categories, all connected to the central spine. Some of the most common ones in Ishikawa diagrams are:
- Methods. Problems in procedures, policies or work methods, such as double handling.
- Materials. Quality or availability of materials, whether raw materials or inputs.
- Machinery. Breakdowns in equipment, tools or technologies used.
- Manpower. Factors related to employees, such as their skills, training or attitudes.
- Measurement. Evaluation of the different parts of the process and the condition of the machinery and materials.
- Mother nature. Conditions such as the physical environment, regulations or external influences.

Example of the Ishikawa diagram in logistics
To begin with, the problem must be recorded in the head of the fish. If, for example, the impact has led to delivery delays, the fishbone diagram can be prepared with the following branches or fishbones:
Methods
- Slow loading and unloading processes. If loading and unloading are inefficient, this causes vehicle departure delays.
- Non-optimised routes. Choosing the wrong transport routes causes order lead times to be pushed back.
- Lack of planning. Lack of correct planning can delay delivery by hours or even days.
- Schedule misalignment. This can occur when schedules are not adjusted to customer needs or traffic conditions.
Materials
- Inadequate packaging. If products are not correctly packaged, they can be damaged, which means the items will have to be picked and shipped again.
- Defective materials. Low-quality materials are likely to cause problems in manufacturing or handling, affecting delivery times.
- Stockouts. Inventory lacking materials or products delays order departures.
Machinery
- Obsolete vehicles. If vehicles are old or in disrepair, the risk of delays increases.
- Poor maintenance. Lack of regular, preventative maintenance can lead to unexpected breakdowns.
- System failures. Any issues with inventory management or shipment tracking systems can lead to delivery errors. This is why it’s advisable to make use of lifecycle management services.
Workforce
- Lack of training. Poorly trained operators or those who do not have tools to assist them with tasks such as picking can make mistakes.
- Work overload. Overburdened staff may have difficulty meeting deadlines.
- Lack of staff. Labor shortages can create bottlenecks in logistic processes.
Environment
- Adverse weather conditions. Storms, snowfall and other atmospheric phenomena may prevent or complicate deliveries.
- Unexpected traffic. Traffic jams and accidents slow down transport times.
- Legal and customs regulations. Customs restrictions and controls can contribute to delays, especially in international transport.
The diagram of Ishikawa visualises all the possible causes of any situation. Through this analysis, the logistics team can prioritise areas requiring immediate improvement and make decisions about route optimisation, staff training and vehicle maintenance. This approach addresses the problem comprehensively and effectively, working towards achieving operational excellence.
Advantages of the fishbone diagram in logistics
The Ishikawa diagram offers numerous benefits in the field of logistics:
- Identification of the causes of a problem. It illustrates in a structured way the root causes of events such as delivery delays, product damage or high costs.
- Clear and organised display. The diagram organises the reasons with hierarchy and clarity, allowing for quick identification of which areas of the process require attention.
- Focus on continuous improvement. Once the origin of the issue has been located, the fishbone diagram facilitates the implementation of corrective and preventive measures. This promotes continuous improvement while contributing to increased efficiency and error reduction.
- Prevention of future problems. By understanding the causes, it’s possible to implement changes that not only solve the current incident but also prevent its recurrence. This makes the logistics system more robust.
- Better decision-making. With a clear understanding, logistics managers can make more informed and effective decisions, resulting in operational improvements.
- Cost reductions. Identifying and eliminating inefficiencies reduces expenditure associated with waste, rework and failures, boosting overall cost-effectiveness.
In summary, the fishbone diagram is a powerful tool for solving problems, optimising processes and enhancing service quality in the lean supply chain, all while fostering a culture of continuous improvement.
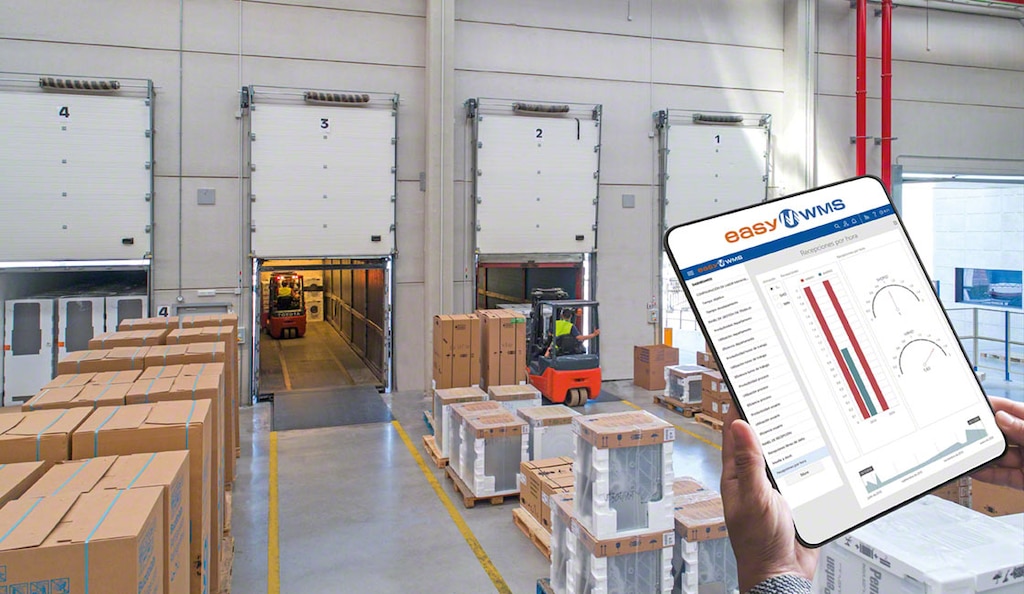
Increase your warehouse efficiency with Mecalux
If you’re looking for comprehensive control of your facilities and inventories, at Mecalux, we can lend a hand. Our Easy WMS warehouse management system enhances the throughput of both manual and automated storage systems. Hundreds of customers use it every day to boost their operations. Contact us for advice on this and other storage solutions.